インテリジェントなコスト分析・自動削減・リアルタイム最適化ツールにより、FinOpsを次のステージへと発展させます。
Most SaaS platforms show fixed dashboards by account or service.They ignore how your organization actually works — by teams, KPIs, and cost ownership.
The result? Teams waste hours reworking data, and leaders get reports with little insight.

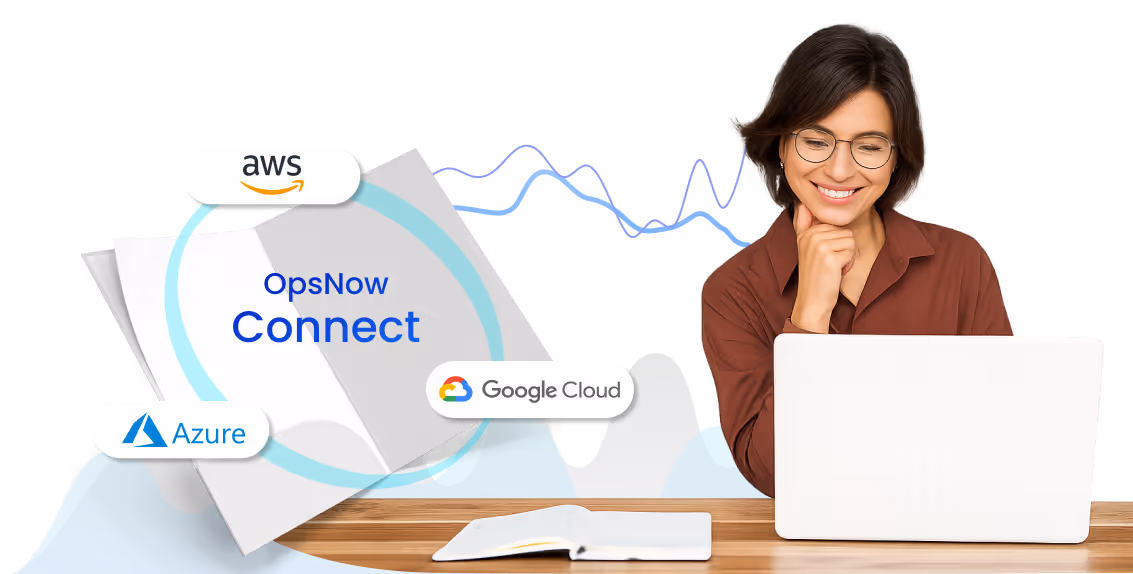
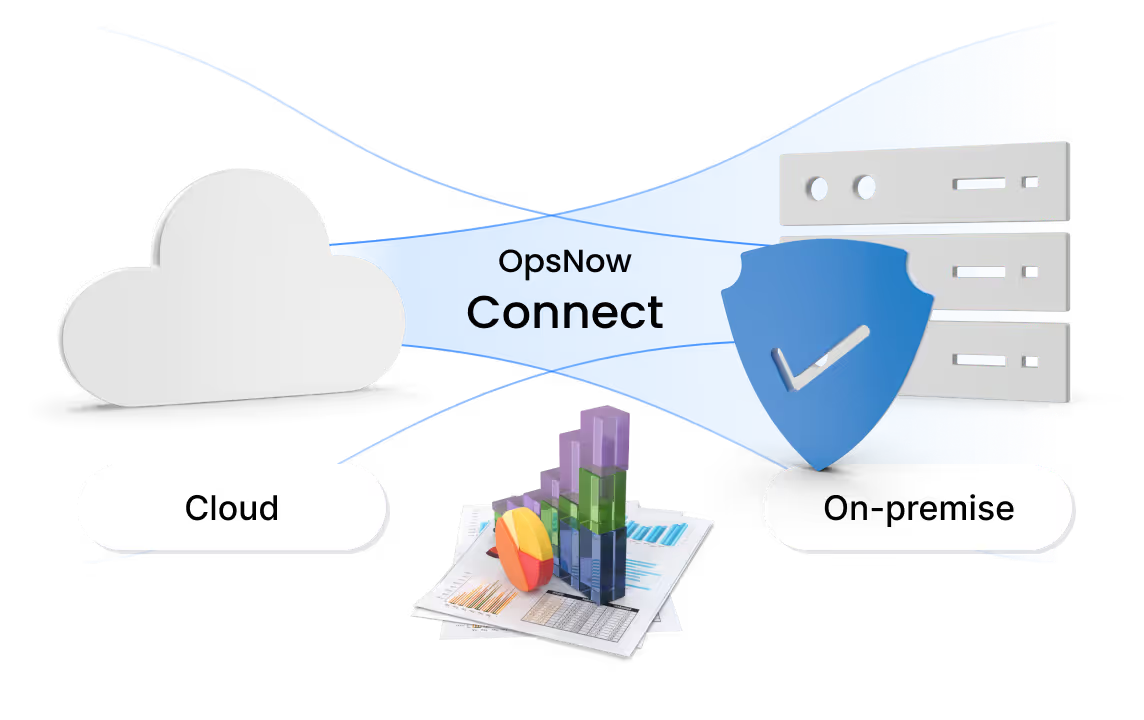
OpsNow Connect turns your multi-cloud data into custom datasets built around your structure, KPIs, and tags.
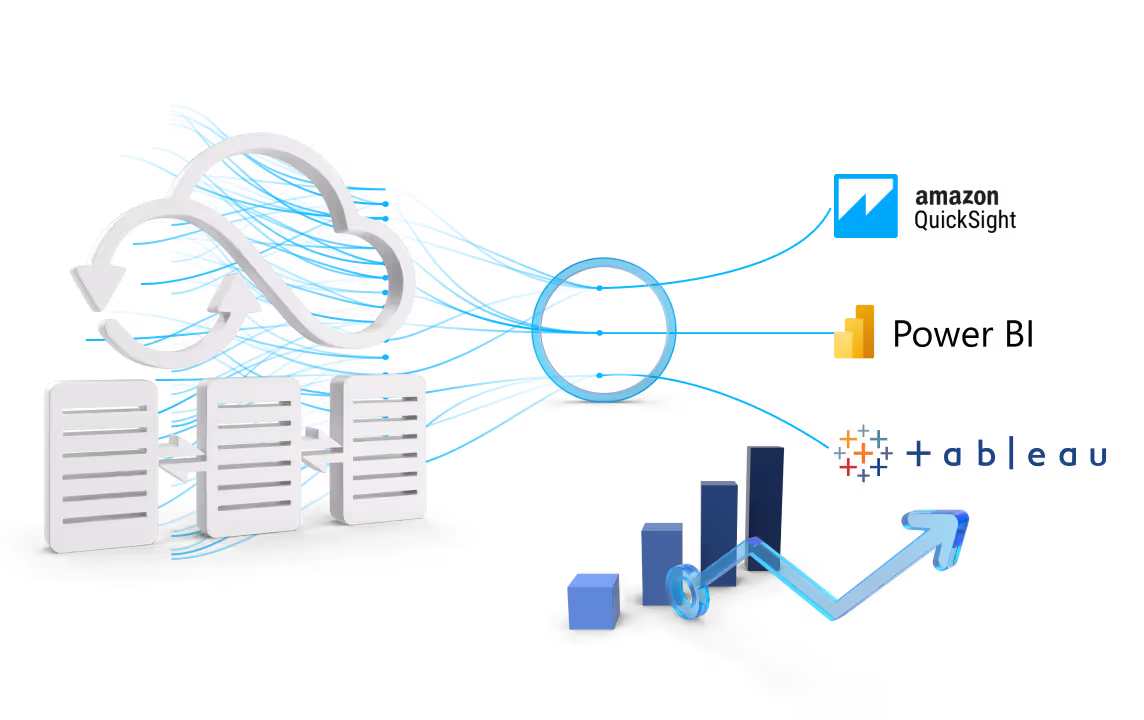
It connects with Power BI, Tableau, or QuickSight — so teams can see cloud usage their way, and take action faster.
The right path depends on your team. Have BI experts in-house?
Or need dashboards built for you? OpsNow Connect adapts to your structure.

OpsNow delivers structured multi-cloud datasets aligned to your KPIs, tags, and org structure—ready for use in your own BI tools like QuickSight or Power BI.
step 1
Define what to measure and which data to use
step 2
Import accounts, tags, and KPIs from multi-cloud environments
step 3
Model datasets around your team structure and cost control needs
step 4
Use your BI tools to build dashboards using the dataset provided
OpsNow builds and delivers custom dashboards and automated reports, so you can focus on insights—not integration.

step 1
Align dashboards with your business goals and KPIs
step 2
Gather multi-cloud data and tagging structure securely
step 3
Shape your data and define how it will be visualized
step 4
Get fully built dashboards delivered by OpsNow experts
step 5
Automate reporting and adapt to changing KPIs with ease
複雑なマルチクラウド環境のコスト・リソース状況をAIで監視し、最適化されたコスト削減手法をご提案します。
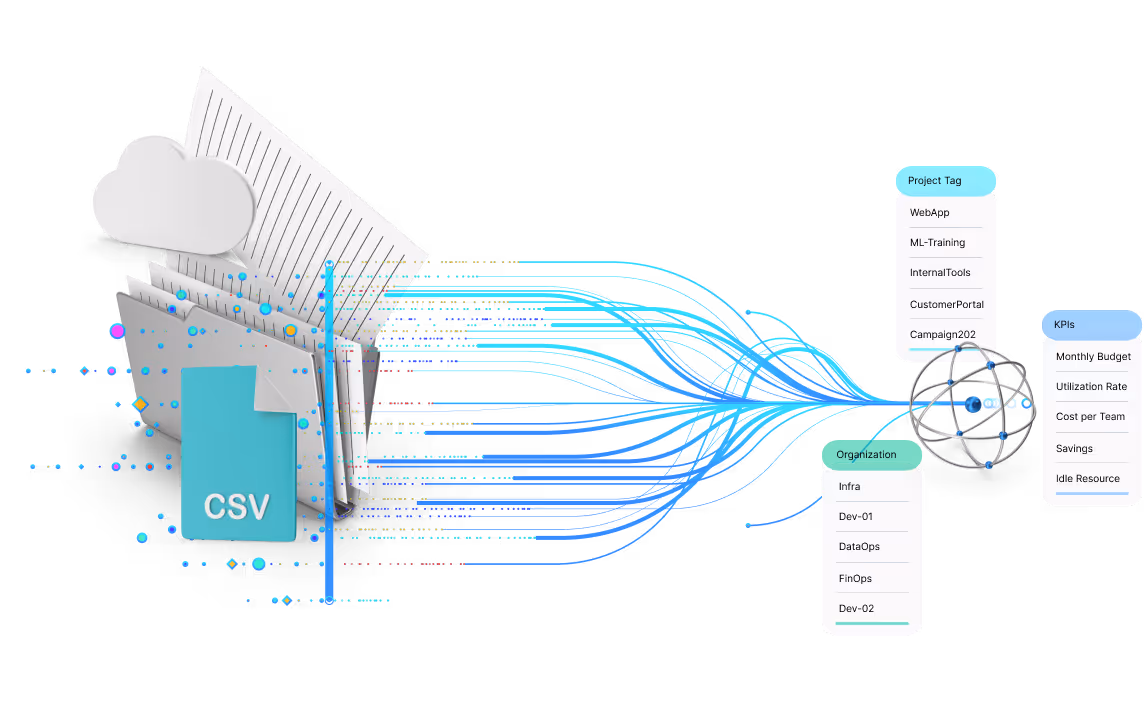
Build datasets based on your organization’s structure, not just cloud accounts.
OpsNow Connect organizes your data around KPIs, tags, and teams to reflect how your business actually operates.
リージョン・タグ・製品などの多様な条件で、最新のクラウド請求データを分析・集計します。
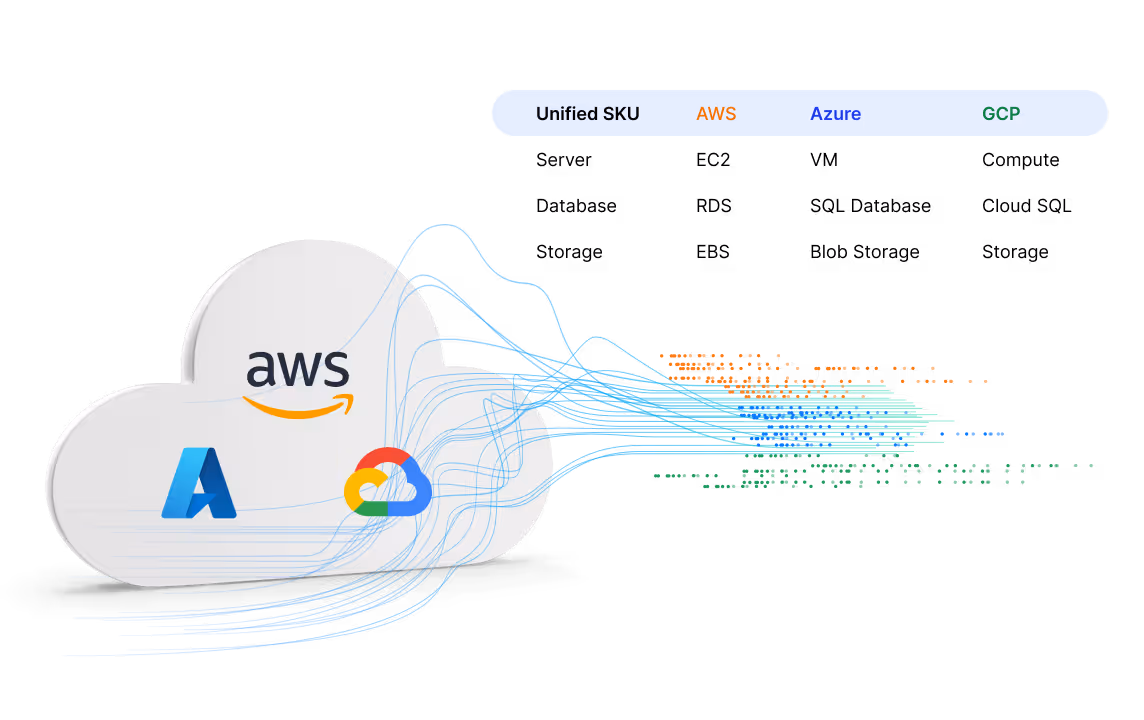
By mapping services to a standardized SKU format, you can compare and manage multi-cloud usage consistently.
クラウドコストやリソース利用状況に関するユーザーの自然言語質問に対し、AI分析がわかりやすい回答をグラフ付きで提供します。
OpsNow Connect outputs structured datasets optimized for external BI tools, making visualization seamless.
クラウドコスト・リソース・性能・セキュリティに関する事前設定済みベストプラクティスポリシーをご用意。標準の300以上のルールから独自ポリシーをカスタマイズ可能です。
OpsNow automatically generates and distributes weekly or monthly reports, customized by department, role, or metric.

Deploy in your own infrastructure—cloud, on-prem, or VPC.
We support secure installation models to meet enterprise data governance and compliance needs.
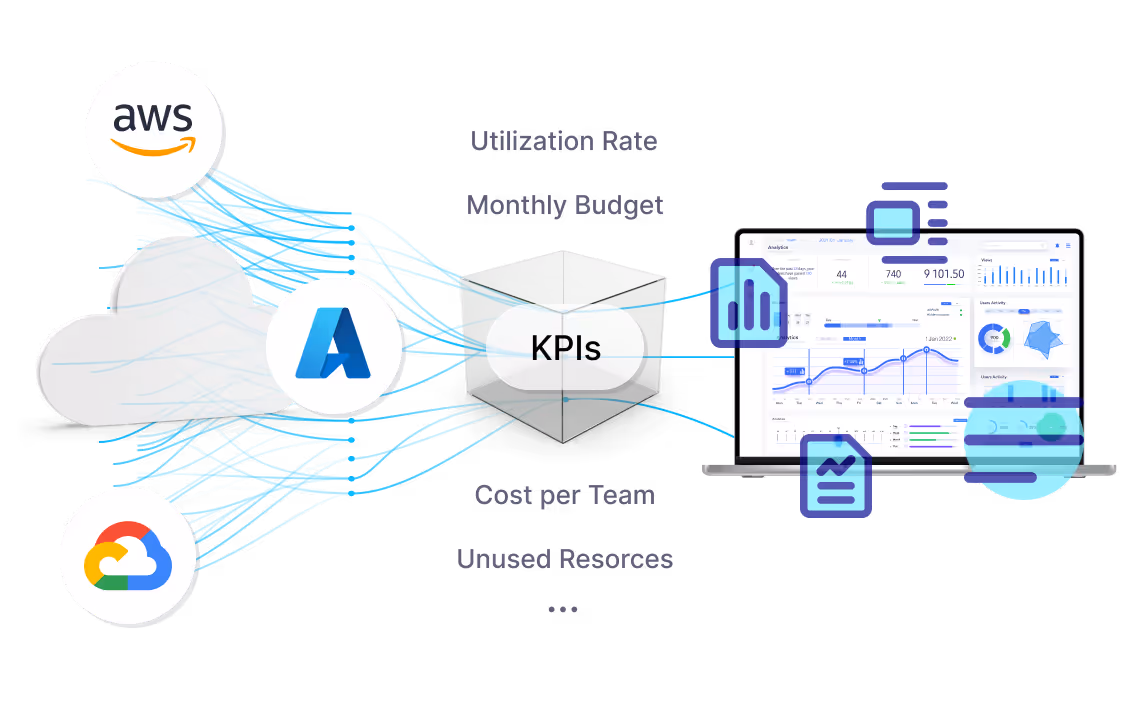
View cloud usage and spend through your business KPIs.
Visualize your cloud environment by cost center, team, or initiative—tailored to your strategic goals.